Everything in my homelab logs somewhere I can query. Container stdout, Talos host services, the Kubernetes audit log, process events, dropped network flows, my router’s firewall, and the VPS that fronts my game servers all land in one ClickHouse table. Metrics live next door in VictoriaMetrics, and Grafana sits on top of both.
I built it before exposing anything from the cluster to the internet. My plan for public workloads assumes one gets compromised eventually, and that plan only works if the evidence is already somewhere the compromised pod can’t reach. It’s also the foundation for my detection pipeline.
Architecture
flowchart LR
  subgraph node[Every node]
    podlogs[Pod logs<br/>incl. audit + Tetragon] --> agent[Vector agent]
    talos[Talos service logs<br/>incl. auditd] --> agent
  end
  unifi[UniFi devices] --> syslogrx[Vector syslog receiver]
  hubble[Hubble dropped flows] --> hubblerx[Vector Hubble receiver]
  edge[Edge VPS<br/>journal + Pangolin] --> edgerx[Vector edge receiver]
  agent --> gw[Vector gateway<br/>normalize, redact, buffer]
  syslogrx --> gw
  hubblerx --> gw
  edgerx --> gw
  gw --> ch[(ClickHouse)]
  vmagent[vmagent] --> vm[(VictoriaMetrics)]
  ch --> grafana[Grafana]
  vm --> grafana
  ch --> detections[Detection orchestrator]
  grafana --> discord[Discord]
  detections --> discord
Collection
A Vector agent runs as a DaemonSet on every node:
- Pod logs: tailed straight from the host filesystem.
- Talos service logs: Talos has no shell and no log files to tail, so a machine config patch sends them as JSON lines to a loopback port the agent listens on.
- Kernel audit events:
auditdruns as a Talos service, so its records arrive with the service logs. - Kubernetes audit log: a Talos patch routes the apiserver audit backend to stdout, so audit events ride the pod log path and get re-tagged as their own dataset.
- Tetragon: process events come out of Tetragon’s export sidecar on stdout, so they take the same path.
Three sources come from outside the node agents:
- UniFi: a small syslog receiver on the server VLAN.
- Hubble: a receiver runs the
hubbleCLI and keeps only the flows Cilium dropped. - Edge VPS: Vector on the VPS pushes its journal and Pangolin’s audit logs over Tailscale to a receiver nothing else can reach. The receiver rebuilds every event from a fixed list of fields, so a compromised VPS can’t pass its logs off as another source.
The gateway
Everything funnels into one Vector gateway. It’s the only thing allowed to write to the logs table, so there’s one place to get redaction right and one set of insert credentials. It does three jobs:
- normalizes every source into one OpenTelemetry-shaped table
- redacts credential-shaped strings before anything is stored
- holds a disk buffer, so a ClickHouse restart means a backlog instead of lost logs
Storage
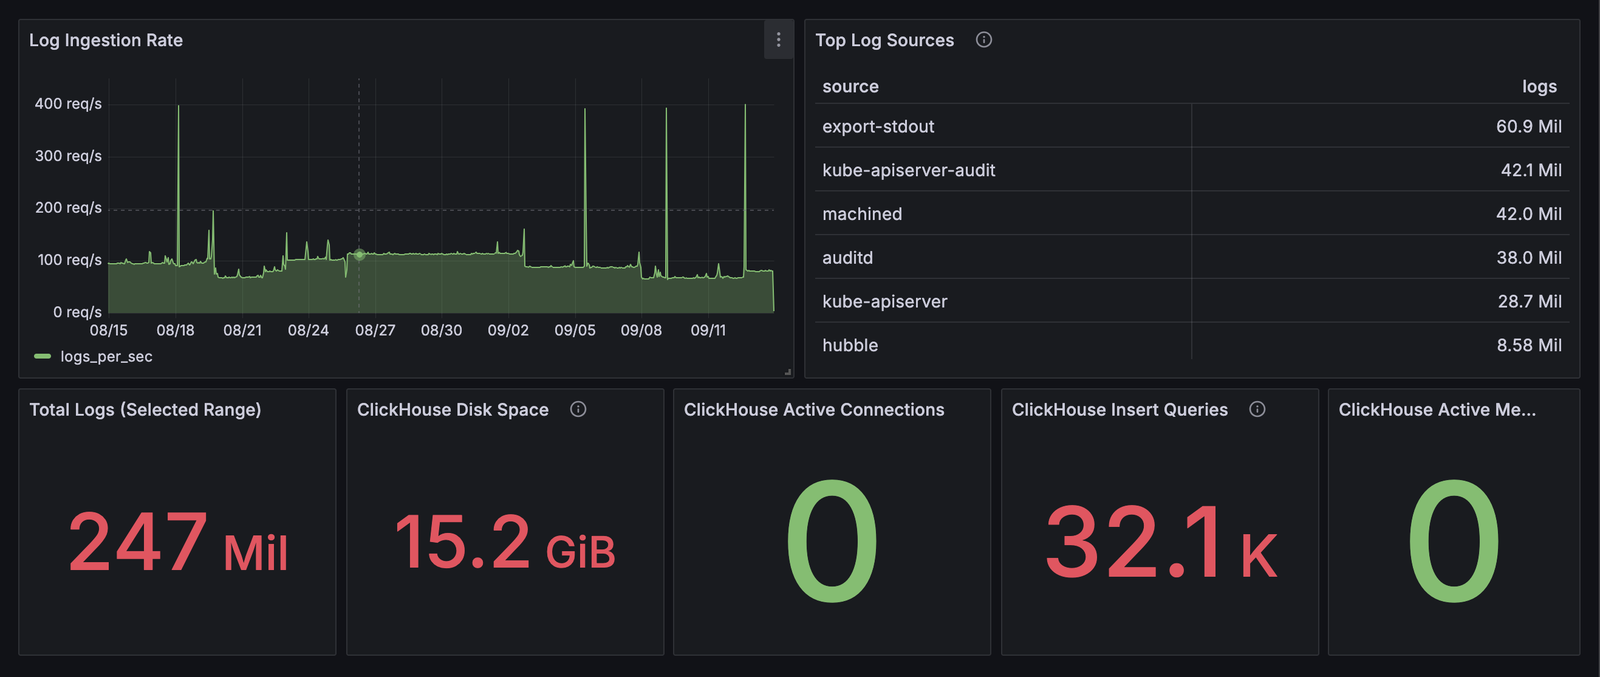
Thirty days of security.logs in Grafana. export-stdout is Tetragon’s export sidecar.
ClickHouse runs as a single node on Enterprise, the biggest of my three nodes. All logs go into one table:
CREATE TABLE security.logs
(
    Timestamp          DateTime64(3) CODEC(DoubleDelta, ZSTD(1)),
    ObservedTimestamp  DateTime64(3) CODEC(DoubleDelta, ZSTD(1)),
    IngestTimestamp    DateTime64(3) DEFAULT now64(3) CODEC(DoubleDelta, ZSTD(1)),
    TraceId            String DEFAULT '',
    SpanId             String DEFAULT '',
    SeverityText       LowCardinality(String) DEFAULT '',
    SeverityNumber     UInt8 DEFAULT 0,
    ServiceName        LowCardinality(String),
    Body               String CODEC(ZSTD(3)),
    ResourceAttributes Map(LowCardinality(String), String),
    LogAttributes      Map(LowCardinality(String), String)
)
ENGINE = MergeTree
PARTITION BY toDate(Timestamp)
ORDER BY (ServiceName, Timestamp)
TTL toDateTime(Timestamp) + INTERVAL 30 DAY
SETTINGS ttl_only_drop_parts = 1;
One raw table keeps ingestion simple. A plain view per source gives each one typed columns: apiserver_audit_events, process_events, hubble_deny_events, and so on. Most views filter on ServiceName, which is first in the sort key, so a query against one source skips everything else.
Partitions are daily because monthly ones were expensive. With a 30-day TTL, ClickHouse can only drop a whole part once every row in it has expired. Once rows started expiring, it rewrote at least 7 GiB a day just to trim one day off a partition, and I could hear it through the case fan. Daily partitions mean an expired day is dropped as metadata, with no rewrite.
Four ClickHouse users keep access narrow:
- The gateway: insert only.
- Grafana: read only.
- The detection orchestrator: reads logs, and writes only its own run history and alert deliveries.
- Detection triage: reads logs, and writes only cases. The case tables have no TTL, so a case keeps its evidence after the logs behind it expire.
The three readers all run with caps on memory, concurrency, and query time.
Metrics
VictoriaMetrics runs single-node with 30 days of retention. vmagent on Picard scrapes kubelet, cAdvisor, kube-state-metrics, node-exporter, and anything annotated for scraping.
Flux doesn’t export a metric for whether its own objects are healthy, so kube-state-metrics reads Flux’s Kustomizations and GitRepository directly and turns each one’s Ready condition into a metric. Grafana alerts when one stays not-Ready for 20 minutes.
Grafana
Grafana runs on Picard, deliberately not on the node that hosts ClickHouse. If Enterprise goes down, the thing that’s supposed to tell me about it hasn’t gone down with it.
Dashboards and alert rules live in Git, one file per dashboard or rule group, provisioned into Grafana. Alerts cover pipeline health, infrastructure, scheduled jobs, the detection orchestrator, and a few security rules that haven’t moved to the orchestrator. They all go to one Discord channel. The orchestrator’s detections post to channels of their own.
What it costs to run
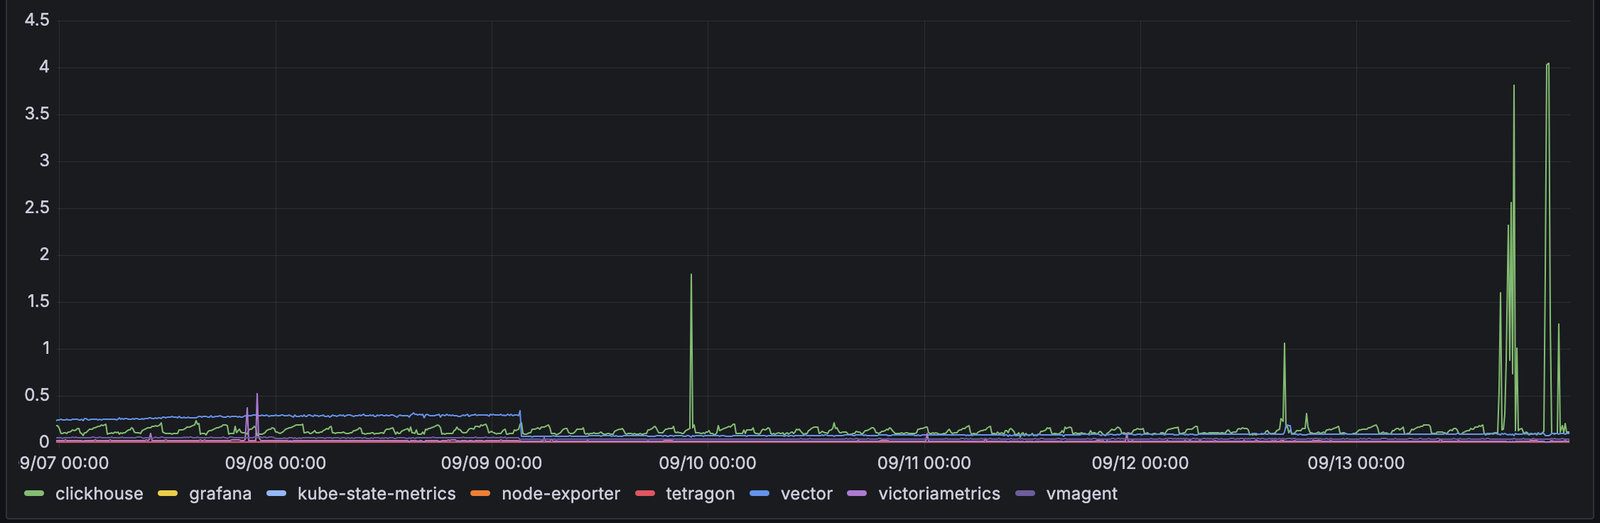
A week of measured CPU in September. The pipeline averaged about 0.4 cores. The spikes are my own ad-hoc searches scanning hundreds of GiB, which run ClickHouse up to its 4-core limit.
The table below is what the manifests declare: requests and limits, not measured usage. A week of measurements in September put ClickHouse’s median CPU at about a tenth of its 1-core request, and the 4-core limit is what the ad-hoc search spikes in the chart run into. A few tiny pieces aren’t listed: sidecars, a canary, and Tetragon’s operator. The detection sweep and drain are CronJobs, so they only hold their share for the few seconds each run takes.
| Component | Where | CPU request / limit | Memory request / limit |
|---|---|---|---|
| ClickHouse | Enterprise | 1 / 4 | 4 GiB / 8 GiB |
| Vector gateway | Enterprise | 250m / 1 | 512 MiB / 2 GiB |
| Vector agent | Every node | 100m / 500m | 128 MiB / 512 MiB |
| UniFi syslog receiver | Enterprise | 50m / 250m | 64 MiB / 256 MiB |
| Edge receiver | Enterprise | 50m / 500m | 128 MiB / 512 MiB |
| Hubble receiver | Any node | 50m / 250m | 64 MiB / 256 MiB |
| VictoriaMetrics | Enterprise | 200m / 1 | 768 MiB / 2 GiB |
| vmagent | Picard | 100m / 500m | 128 MiB / 512 MiB |
| kube-state-metrics | Picard | 50m / 200m | 64 MiB / 256 MiB |
| node-exporter | Every node | 50m / 200m | 64 MiB / 128 MiB |
| Grafana | Picard | 100m / 500m | 128 MiB / 512 MiB |
| Tetragon agent | Every node | 100m / 500m | 128 MiB / 1 GiB |
| Detection sweep | Any node | 50m / 250m | 64 MiB / 128 MiB |
| Detection drain | Any node | 50m / 250m | 64 MiB / 128 MiB |
| Total (three nodes) | ~2.7 / ~12.3 | ~6.9 GiB / ~19.4 GiB |
Why this stack?
ClickHouse was the real decision, so it gets its own section below: Why ClickHouse and not a SIEM?
Vector
Fluent Bit was the alternative. It’s smaller, but Vector fits this design better:
- a documented agent and aggregator topology, which is exactly the gateway trust boundary I wanted
- a built-in ClickHouse sink with acknowledgements and disk buffers
- transforms good enough for normalization and redaction in config
The cost is VRL, one more small language to maintain. It has no user-defined functions, so my seven redaction passes are copied out three times: once for the log body and once for each attribute map.
VictoriaMetrics
It’s Prometheus-compatible, so every exporter and dashboard just works. The separate vmagent scraper buffers to disk if the store is unavailable, and VictoriaMetrics stores the same history in less space than Prometheus. I skipped kube-prometheus-stack on purpose. It brings an operator, CRDs, its own Grafana and Alertmanager, and a pile of default rules and scrape targets.
Grafana
One UI over both stores, so logs and metrics sit side by side. It was also my first detection engine, until it went blind for a day without telling me. The detection pipeline post covers what replaced it.
Why ClickHouse and not a SIEM?
The usual homelab answer for security monitoring is a SIEM. Wazuh gets recommended most, with Security Onion and Elastic Security close behind. I’ve considered running one twice, and both times I picked a plain data store.
What a SIEM gives you
A SIEM is a whole product: agents to collect logs, an index to store them, a rule library, correlation, and somewhere to review what fired. Wazuh and Elastic Security can act on an alert, and not just raise it.
What a SIEM would cost me
- Memory. Every node is shared with Jellyfin, game servers, and everything else I run. Security Onion calls 24 GB the bare minimum for a standalone install right now. Wazuh’s all-in-one install wants 8 GB for up to 25 agents, and 16 GB is recommended for its indexer alone. My entire homelab runs on ~7GB with a 19GB limit.
- A second pipeline. Wazuh, Security Onion, and Elastic Security all want to own ingestion, through their own agents, Beats, or syslog forwarding. None of them reads what Vector already normalizes. Kubernetes, Talos, and flow logs would still need a general pipeline, so I’d be running a second log store (OpenSearch or Elasticsearch underneath) next to the first one, not replacing it.
- Solving a bigger problem than mine. I’m a one human, not a staffed SOC, I don’t really need all of the features.
The data stores I compared
Without a SIEM, the question becomes which store to put under Grafana, with detections written as code:
| Store | Best at | Trade-off |
|---|---|---|
| ClickHouse | SQL over structured events, compression, fast scans | Schema, tuning, and query memory are my job |
| VictoriaLogs | The simplest, lightest single-node log store | LogsQL instead of SQL |
| Loki | Kubernetes log search with a mature UI | Label discipline is load-bearing, and LogQL is awkward for multi-event questions |
| OpenSearch Security Analytics | Sigma rules, findings, and correlation: halfway to a SIEM | The heaviest to run by far: JVM heap, indices, mappings, and a security plugin |
| PostgreSQL or TimescaleDB | Familiar SQL in a small deployment | Not built for continuous high-volume ingest and wide time scans |
| Parquet and DuckDB | Almost nothing running when idle, great for local analysis | No continuous ingest, retention, or alerting. Better as an offline archive |
Why ClickHouse won
- SQL. It’s the language I already write detections in at my day job. A second query language is an ongoing cost, not just a learning curve.
- One database for everything. Raw events, ad-hoc hunting, aggregations, and detections all run against the same tables. Questions that span sources are just a join: one of my detections checks a shell in a Jellyfin pod against the Kubernetes audit log to see whether I opened it with
kubectl execa few seconds earlier. - Not the smallest footprint. VictoriaLogs is lighter, and would have won if every detection were a single-source filter. Mine join across sources.
What I gave up is the SIEM’s workflow: a Sigma rule library, a findings UI, built-in response. case management. I’ve been building back the pieces I actually need. Matches now group into cases, and a model reads each new case before I do. The detection pipeline post covers the runner.
What isn’t built yet
- mTLS between agents and the gateway. The original design had it. Cilium network policy is the boundary for now.
- Kernel log forwarding from Talos. Kernel audit events arrive through
auditd, but the kernel’s own message log doesn’t. - Typed materialized tables for the busiest sources. Parsing JSON at query time is fine at today’s volume, but every new detection adds to it.
- A real credential ruleset. My regex only knows the shapes I’ve written. An open-source ruleset like Gitleaks’ or TruffleHog’s covers hundreds more.