My observability pipeline collects logs from containers, hosts, and network flows in ClickHouse. The detection pipeline builds on it:
- scheduled SQL queries run against those logs
- matches go to Discord as alerts
- a model triages them
Hardening comes first, but a misconfiguration, a zero-day, or a supply chain attack can still get someone past it. Detection gives me a chance to spot that and respond. tl;dr: defense in depth.
I enjoy this part of security. In one week in early October, it made about 69,000 detection runs across 38 rules without an error, delivered 4,010 matches, and dead-lettered none.
What’s in the stack?
| Piece | Choice | Why |
|---|---|---|
| Cluster activity | kube-apiserver audit log | Who did what to the cluster, like RBAC changes, Secret reads, and exec into pods |
| Process activity | Tetragon | Process execs that already carry pod, container, and workload identity |
| Network activity | Hubble | Flows Cilium dropped, with the source pod attached |
| Runner | A small Python orchestrator | Tracks which logs have been checked and resumes after an outage |
| Triage | A scheduled agent workflow on my workstation | Groups matches into cases for a model to judge |
| Scheduling | Two Kubernetes CronJobs | No scheduler service to run, and Forbid skips overlapping runs |
| Notifications | Discord | It’s where I already look. Alerts, cases, and escalations each get a channel. ClickHouse is the system of record |
| Meta-monitoring | Grafana | Runs on a different node than ClickHouse and alerts when the orchestrator itself breaks |
Why a custom orchestrator?
My first detections ran as Grafana alert rules against ClickHouse. Two things pushed me off them:
- I couldn’t see what matched. A Grafana rule needs a number to compare against a threshold, so every detection was a
SELECT count(). The alert said something matched, and I re-ran the query in Explore to find out what. - Nothing tracked which logs had been checked. Each evaluation looked back over a sliding window, like the last 15 minutes. After a gap longer than the window, the older events never got checked.
The second one bit me. A config change of mine broke Grafana’s ClickHouse permissions, and most detections were blind for about 25 hours. I needed a cursor that picks up where the last successful query left off.
Nothing I looked at fit:
| Option | Why not |
|---|---|
| A SIEM | Wants to own ingestion. See why not a SIEM |
| ClickHouse materialized views | Every count-based detection rewritten as aggregate state, and still nothing to deliver matches |
| Sigma plus a ClickHouse backend | The only backend was a 2-star hobby project, and Sigma’s just a compiler |
| ElastAlert2 | Right shape, but built for Elasticsearch |
| rsigma | The closest fit, but it processes a live stream and doesn’t speak ClickHouse |
| Kestra | Re-runs missed jobs, which isn’t tracking checked logs, and it’s a new service with its own database |
So I wrote a small runner and borrowed rsigma’s delivery design:
- a persistent cursor with a buffer for late logs
- an outbox, so delivery is separate from detection
- retries with backoff that honor
Retry-After - a dead-letter state for alerts that keep failing
It’s mine to keep reliable now, and the first version wasn’t (see the outbox).
Architecture
flowchart LR
  subgraph sources[Log sources]
    audit[kube-apiserver audit]
    tetragon[Tetragon process events]
    hubble[Hubble dropped flows]
    pods[Pod logs]
  end
  sources --> vector[Vector] --> logs[(ClickHouse)]
  defs[detections/*.yaml] --> sweep
  sweep[detection-sweep<br/>every 5 min] -->|"query (cursor, window_end]"| logs
  sweep -->|pending matches| outbox[(detection_results)]
  sweep -->|advance cursor| progress[(detection_progress)]
  sweep -->|one row per detection run| runs[(detection_runs)]
  drain[detection-drain<br/>every 1 min] -->|read pending| outbox
  drain -->|embed, thread, payload| discord[Discord]
  triage[detection-triage<br/>every 4 hours, on my workstation] -->|read matches| outbox
  triage -->|cases and verdicts| cases[(detection_cases)]
  drain -->|read undelivered cases| cases
  drain -->|case threads, escalations| discord
  grafana[Grafana PIPE rules] -.->|errors, silence| runs
  grafana -.->|stuck, dead-lettered| outbox
  grafana -.->|crashed Jobs| sweep
  grafana -.->|crashed Jobs| drain
The orchestrator is about 1,300 lines of Python in one container image, run as two CronJobs: detection-sweep every five minutes and detection-drain every minute.
The sweep only talks to ClickHouse, and the drain is the only pod that holds the Discord credentials. Neither one can talk to the Kubernetes API.
Each detection used to run as its own CronJob, locked with a Kubernetes Lease. That needed Kubernetes API access, and it still broke when eight detections started in the same minute and hit ClickHouse’s five-query cap.
Now one pod runs every detection in order, so only one query runs at a time, and the Lease and the Kubernetes access are gone.
The downside is that a serial sweep is only as fast as its slowest query. One that hangs for its full two-minute timeout holds up everything behind it.
The cursor
Each detection keeps a cursor in ClickHouse, which holds the timestamp it has queried through. Here’s one run:
- Read the cursor.
- Set the window end to ClickHouse’s current time minus three minutes.
- Run the detection’s SQL from the cursor to the window end.
- Save every match to
security.detection_resultsaspending. - Move the cursor to the window end.
- Record the run as
okorerrorinsecurity.detection_runs.
If a run fails before step 5, the next one starts from the same spot. When I accidentally knocked ClickHouse offline for about 50 minutes, the detections caught up on the whole gap once it came back.
Three details keep it from missing logs.
- ClickHouse’s clock, not the pod’s. The window end comes from
SELECT now64(), so clock skew can’t open a gap. - The three-minute buffer gives late logs time to land.
kubectl execaudit events arrive within 34 seconds 99% of the time, but anything later than three minutes is missed. - A six-hour cap. After an outage, each run covers at most six hours past the cursor, so the catch-up happens in chunks.
The outbox
My first version did everything in one run. It queried, saved matches, posted to Discord, and then moved the cursor. If Discord failed, the next run redid the whole thing. One morning a stale bot token broke the Discord thread step while the embed step kept working, so every retry posted the same alert again. I ended up with three copies and no payload.
Now it’s two jobs that don’t wait on each other:
- sweep: query -> save matches as pending -> move cursor
- drain: find pending matches -> post to Discord -> mark sent
The sweep doesn’t care whether Discord is up. The drain retries each Discord call (embed, thread, payload) on its own, and marks a match dead after five failed attempts.
ClickHouse is bad at updating rows in place, so each status change inserts a new copy of the row under the same key. ReplacingMergeTree collapses the copies in the background, and the drain reads with FINAL to see the latest. A nice side effect is that the orchestrator’s account can insert rows but can’t modify or delete them. 😄
Delivery isn’t duplicate-free. If the drain crashes after Discord accepts a post but before it records the success, the retry posts it again.
What a detection looks like
Detections are plain YAML files in the repo, loaded into a ConfigMap the sweep reads, so adding a detection is adding a file. A file that won’t parse crashes the whole sweep on purpose. A crashed sweep will trip an alert, ensuring a broken detection isn’t silent. The downside is that one bad file blinds every detection until I fix it.
SEC-002 is a detection that watches for a ServiceAccount running exec, attach, or port-forward against a pod, or adding an ephemeral debug container to one.
A ServiceAccount token is what an attacker gets by compromising a pod, so one doing any of these can mean someone is moving to the next pod. It matches whether the API server allowed the request or not, because a denied attempt is worth seeing too.
Until October, all 671 of these requests in my audit history came from my own admin account, never a ServiceAccount. Now there’s one exclusion. My backup job runs sh in its own throwaway inspect pods, and the rule names each of those pods. Anything else goes straight to me (trimmed for the post):
detection_name: SEC-002
name: ServiceAccount pod exec/attach/port-forward or ephemeral container request
description: >
  A ServiceAccount requested pod exec, attach, port-forward, or access to the ephemeralcontainers subresource. Investigate whether the request succeeded and whether it was expected.
severity: 1 # 1-5, lower is more severe
sql: |
  SELECT Timestamp, username, verb, subresource, object_namespace, object_name
  FROM security.apiserver_audit_events
  WHERE Timestamp > {watermark:DateTime64(3)}
    AND Timestamp <= {window_end:DateTime64(3)}
    AND subresource IN ('exec','attach','portforward','ephemeralcontainers')
    AND username LIKE 'system:serviceaccount:%'
    AND stage = 'ResponseComplete'
    AND NOT (...) -- one ServiceAccount's exec into its own named pods
  ORDER BY Timestamp
entity: [username]
triage_fields: [Timestamp, username, verb, subresource, object_namespace, object_name, ...]
pivots:
  - name: actor_requests
    description: What the same identity asked the API server for, 15 minutes either side.
    sql: ...
escalate: always
The less obvious fields:
| Field | Used for |
|---|---|
detection_name | The detection’s ID. It names its cursor and its Discord thread, and is part of each match’s identity |
sql | The query. Every row it returns is one match, with no separate threshold stage |
entity | What triage groups a burst of matches on, so ten matches from one ServiceAccount become one case |
triage_fields | The only columns allowed into a case’s evidence, so the only ones the model and the case posts see |
pivots | Fixed queries run around each match, so the evidence carries context and not just the hit |
escalate | always sends every case straight to me, whatever the model thinks |
Anatomy of a query
Each source has a view with typed columns, so a detection filters on k8s_workload instead of digging through JSON. Every detection query has the same five parts. SEC-007 watches my public namespace, where the internet-facing services live:
-- 1. What to return: these columns become the alert's payload
SELECT Timestamp, k8s_pod, k8s_container, k8s_workload, k8s_namespace, binary, arguments, parent_binary
-- 2. Where to look: a view that turns raw Tetragon JSON into columns
FROM security.process_events
-- 3. The window: filled in by the orchestrator on every run
WHERE Timestamp > {watermark:DateTime64(3)}
  AND Timestamp <= {window_end:DateTime64(3)}
-- 4. The behavior: a shell started inside the public namespace
  AND event_type = 'exec'
  AND k8s_namespace = 'public'
  AND (binary LIKE '%/sh' OR binary LIKE '%/bash' OR binary LIKE '%/busybox')
-- 5. The exclusions: shells known to be legitimate (trimmed for the post)
  AND coalesce(k8s_workload, '') NOT IN (...)  -- standing test pods
  AND coalesce(k8s_container, '') != (...)     -- a cert-watching sidecar
  AND NOT (...)                                -- Jellyfin shells opened by kubectl exec, see Tuning
ORDER BY Timestamp
This rule is a tripwire. It matches shells by path, so an attacker who runs python -c or copies sh to /tmp/x walks right past it. It’s a cheap way to catch a common behavior. Covering the gaps is a job for other detections and, eventually, hunting.
The SELECT list matters, because it’s exactly what reaches Discord. SEC-006 matches secrets that leaked into pod logs, so it deliberately doesn’t select the log line, which would forward the secret straight into the alert. Triage adds a second gate. SEC-007’s alert carries the process arguments, but its cases leave them out until I decide they’re safe to hand a model.
Tuning
SEC-007 kept firing on shells in Jellyfin, so I excluded the whole Jellyfin workload. Every one of those shells turned out to be me running kubectl exec. Jellyfin never starts a shell itself, so the exclusion was only hiding the shell SEC-007 exists to catch, one started by a compromised Jellyfin. 🤦
Now it skips a Jellyfin shell only when the audit log shows a successful kubectl exec into the same pod and container, running the same command, within a few seconds. Any other shell in Jellyfin still alerts.
An exclusion should be exactly as wide as the evidence behind it.
The alert
With the three-minute buffer and the five-minute sweep, an alert lands in Discord three to nine minutes after the event. Each one has:
- An embed with the detection name, description, ID, severity, and match count.
- A thread on that message, named after the detection.
- A summary and
payload.jsonin the thread. The file holds every matched row. The summary is there because Discord’s mobile app can’t open JSON.
Triage adds a 👀 once it picks the alert up, or a 🚨 if the case was escalated.
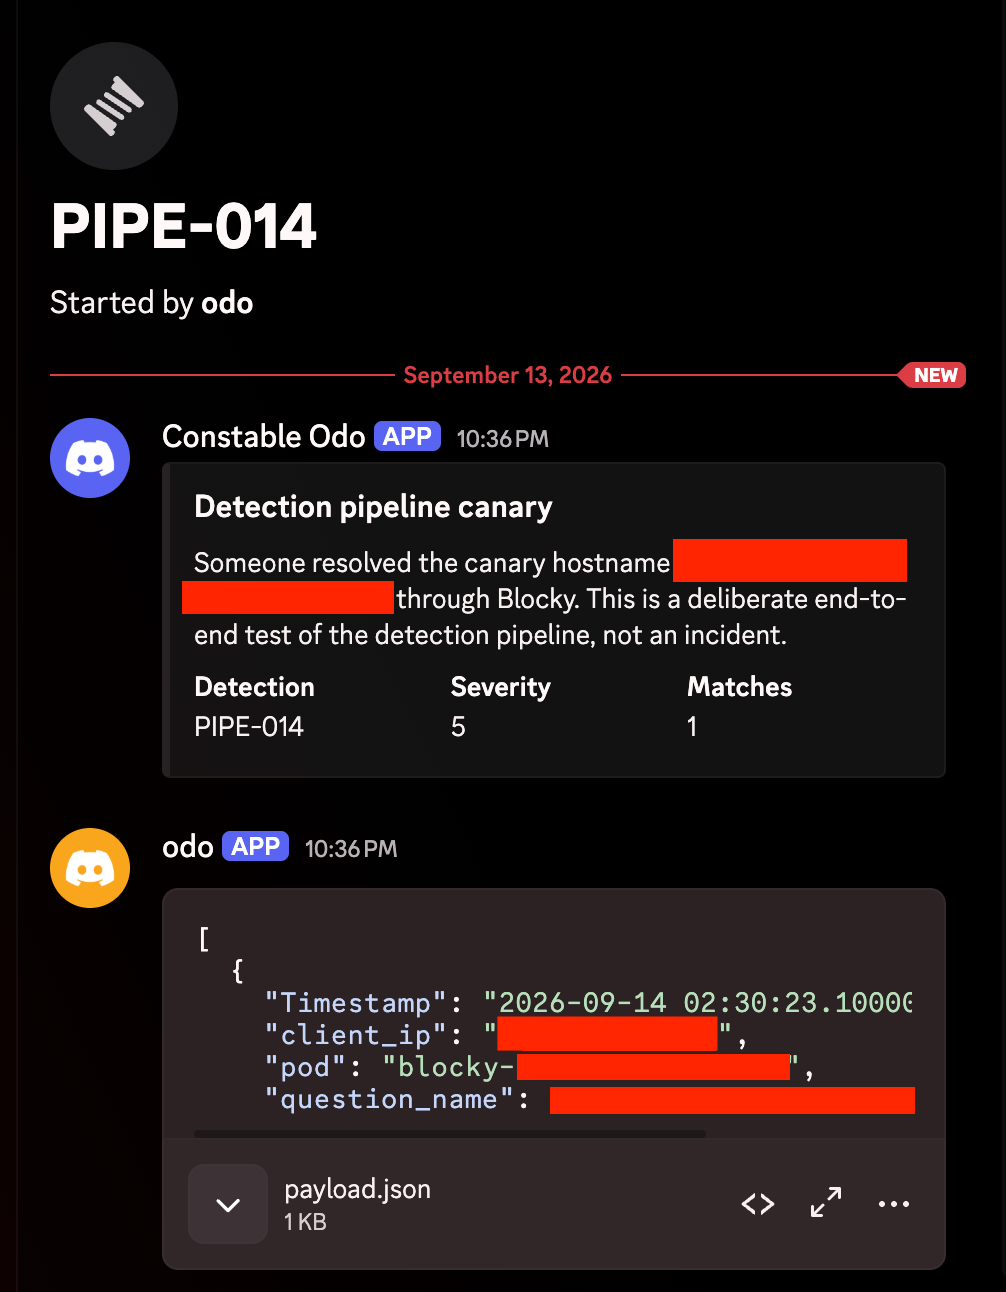
The PIPE-014 canary firing, about six minutes after the lookup. The JSON is Discord’s preview of the payload.json attachment.
Matched rows hold attacker-influenced text, so the payload is always a file, never a code block. A backtick in a process argument could close a code fence and inject Markdown, including @everyone, and Discord never parses an attachment as Markdown.
In the summary, each value sits in an inline code span with its backticks swapped for a lookalike, and mentions are off on every message anyway.
A webhook URL is a credential, since the token is in the path. A DNS failure once made requests put the full URL in an exception 🙈. It landed in pod logs, which my own pipeline then shipped into ClickHouse. Errors are redacted now, and re-raised without the original exception attached.
Watching the watcher 👀
A detection pipeline that fails silently is worse than none, because you trust the quiet. Grafana runs five rules against the orchestrator itself:
- PIPE-009: a detection run recorded an error
- PIPE-010: a sweep or drain Job crashed
- PIPE-011: matches stuck in
pending - PIPE-012: matches dead-lettered
- PIPE-013: no runs recorded in 15 minutes, or the sweep is suspended or not scheduled. A failed query counts as silence too
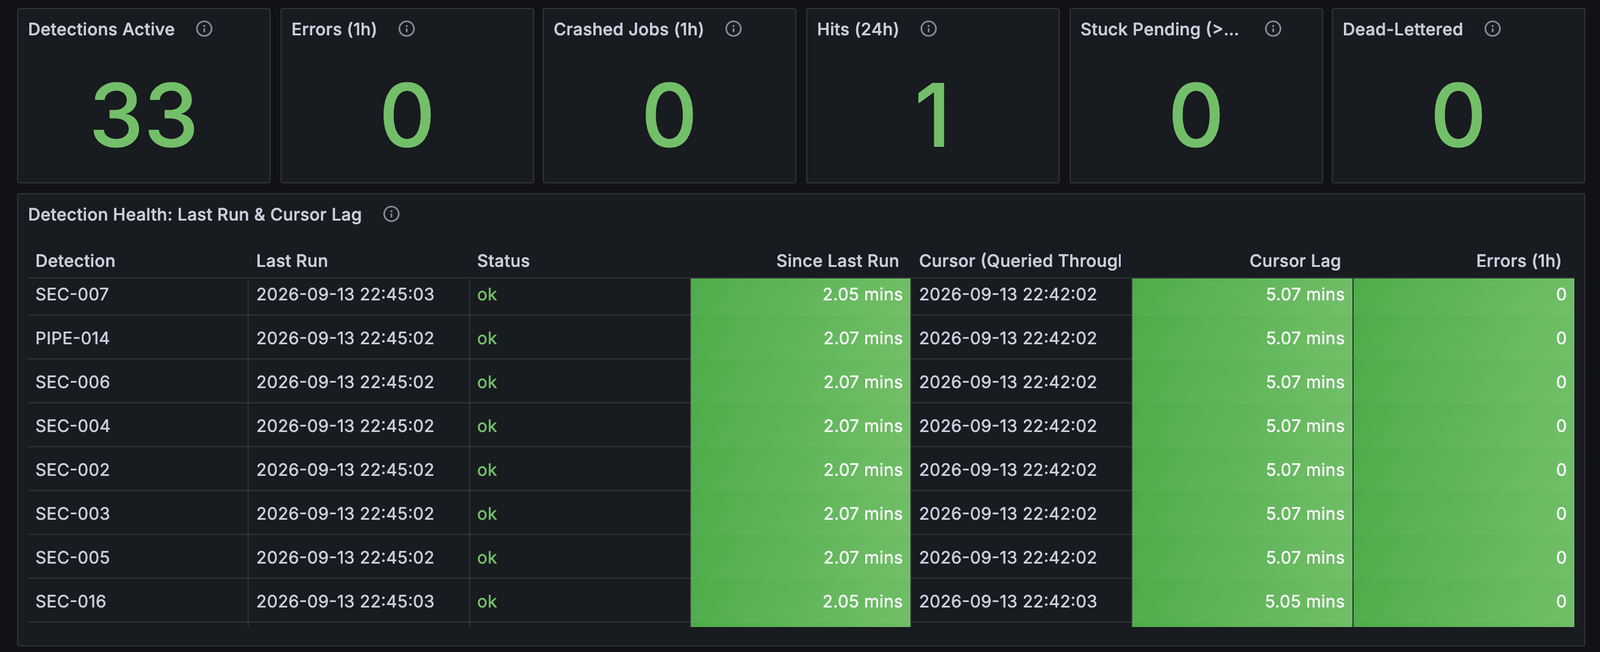
The orchestrator’s Grafana dashboard. The stat panels show the same signals the PIPE rules alert on.
Two more check the ends of the path:
- PIPE-014 is a canary. It fires only when I resolve a made-up hostname through Blocky, so I can prove on demand that a real match still becomes a Discord alert.
- PIPE-019 fires when an alert goes eight hours without a 👀, which means nothing triaged it. That happens if my workstation is asleep, the model keeps failing, or the drain can’t react. It reads ClickHouse, not Discord, so faking or deleting a reaction doesn’t fool it.
Triage
Alerts were landing, but nobody was reading them. Between 09/14 and 09/24, 339 matches fired and I reviewed none. 249 of them were Flux’s controllers getting denied on Secrets.
Most matches are me doing admin work or a rollout, but I won’t exclude my own activity. A detection that’s blind to my admin actions is also blind to someone who stole my admin session. I needed something to sort the noise.
I investigate alerts with SQL against ClickHouse, but let’s be real, I’m not trying to be on-call all day, so my buddy Claude runs some queries for me.

Now that happens on a schedule. Every four hours, a workflow groups new matches into cases, freezes the evidence for each one, and has a model with no tools label it as a true positive, benign, a false positive, or a duplicate. Each case gets one Discord message. When I disagree with a verdict, I record a correction with a reason.
Code decides what escalates. A case goes to me if it’s a true positive, has a high risk score, comes from an escalate: always detection, or is still unjudged after eight hours. Those post to an escalations channel and put a 🚨 on the case’s alerts. Every match still reaches Discord first, so no model call can delay or suppress an alert.
I don’t know yet how often the model agrees with me. That takes a month of corrections.
What’s next
Next is a runbook_url in the detection YAML, so an agent can follow the investigation steps when a detection fires. After that comes hunting.
Further reading
- How Reddit does Threat Detection - r/RedditEng: My coworker Austin wrote this about the pipeline we use at work.